Marriage, Divorce, and the COVID-19 Pandemic in the U.S.
Source: NCFMR analyses of CDC/NCHS, National Vital Statistics System, U.S. Census Bureau, Population Division Annual Estimates of the Resident Population; IPUMS USA, University of Minnesota, www.ipums.org.
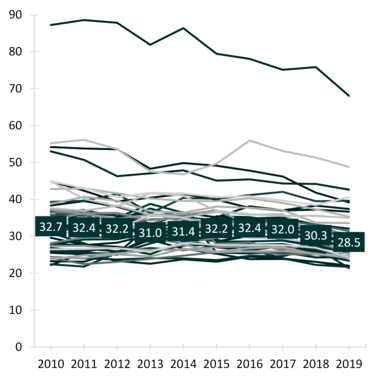
Note: Adjusted marriage rates for the state of Nevada are excluded due to extreme values.
Marriages and Divorces in 2020 – What Does the Administrative Data Reveal?
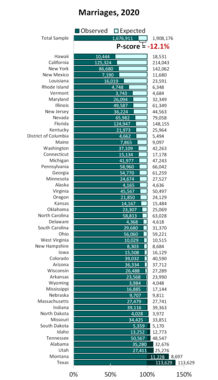
- Based on estimates of the percent change from 2018 to 2019, we anticipated there would be 1.9 million marriages in 2020. However, NCHS data reveal there were only about 1.6 million marriages. This represents a shortfall of 231,265 marriages, or a 12% decline.
- These results varied by state. Some states recorded large percent declines, like Hawaii with 43.6% fewer marriages, California with 41.5% fewer, and New York with 39%.
- Nine states had no shortfall. Texas recorded 38% more marriages and Montana 29%. Upon investigation, it was discovered that Montana law allows for “double proxy marriages” in which neither party need be physically in the state to wed. During 2020, the state reported 4,300 double proxy weddings compared to 1,200 in 2019 (CBS News, Sunday Morning, February 13, 2022).
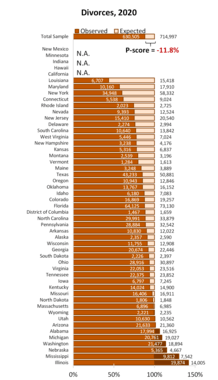
- We expected 714,997 divorces would occur in 2020. However, only 630,505 did so. As with marriages, this decline represented a 12% reduction in the number of divorces occurring in 2020.
- The two states with the largest percent declines were Louisiana (56.5%) and Maryland (43.3%) fewer divorces.
- As with marriages, at the close of 2020 not all states ended the year with fewer divorces—eight states had more divorces than expected. The two largest increases were found in Illinois (41.9%) and Mississippi (30.1%).
 State and for the Nation, 2020" width="1469" height="2560" />

 State and for the Nation, 2020" width="1470" height="2560" />

Source: NCFMR analyses of CDC/NCHS, National Vital Statistics System; U.S. Census Bureau, Population Division Annual Estimates of the Resident Population; U.S. Census Bureau, 2020 American Community Survey, 1-year Experimental PUMS
Data Sources:
CDC/NCHS, National Vital Statistics System
U.S. Census Bureau, Population Division Annual Estimates of the Resident Population
